# Visualizer
These XState v4 docs are no longer maintained
Stately Studio (opens new window) is now the best way to visualize your state machines. And XState v5 is out now! Read more about XState v5 (opens new window)
The XState Visualizer (opens new window) is a tool for creating and inspecting statecharts to visualize the state of your applications.
As a visual tool, the Visualizer helps developers get an overview of their application logic, as well as making it easy to share and with designers, project managers and the rest of the team.
- Write your application logic and immediately visualize it.
- Save your statecharts to the Stately Registry and share them with anybody.
- Share your statecharts in your team’s documentation with embedded mode and live-updating snapshot images.
The Visualizer already has many features to help you make your code do more.
# Write and visualize your code
Write and visualize your code instantly
- Use the code editor in the Code tab to write your machine code.
- Press Visualize to visualize your machine.
# Share your machines
There are multiple ways you can share your machines with your team and across the web.
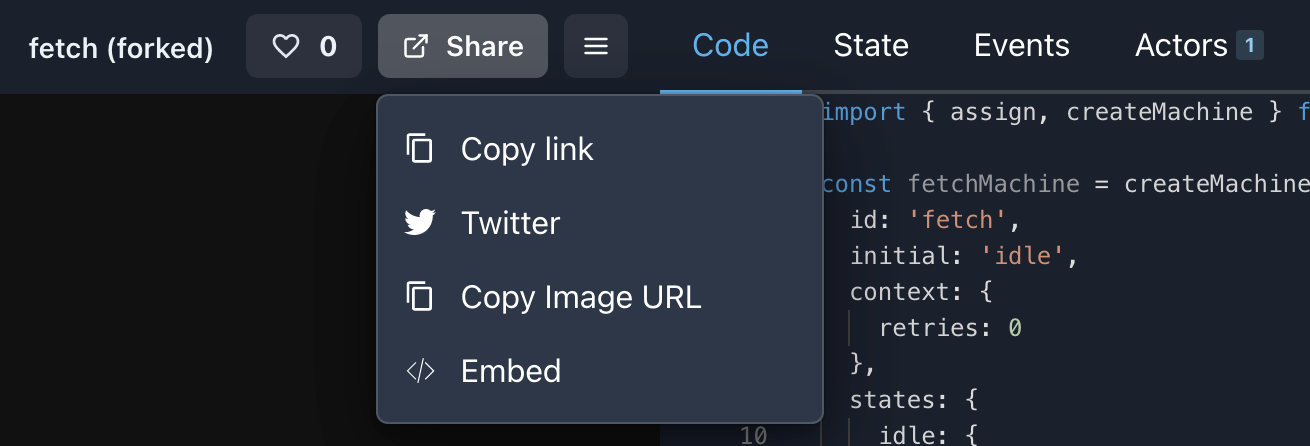
The share menu contains four options:
- Copy link. Copy the Visualizer URL for the machine.
- Twitter. Composes a tweet with a link to the machine.
- Copy Image URL. Copies a URL for a snapshot image of the machine.
- Embed. Creates an embeddable iframe containing the machine.
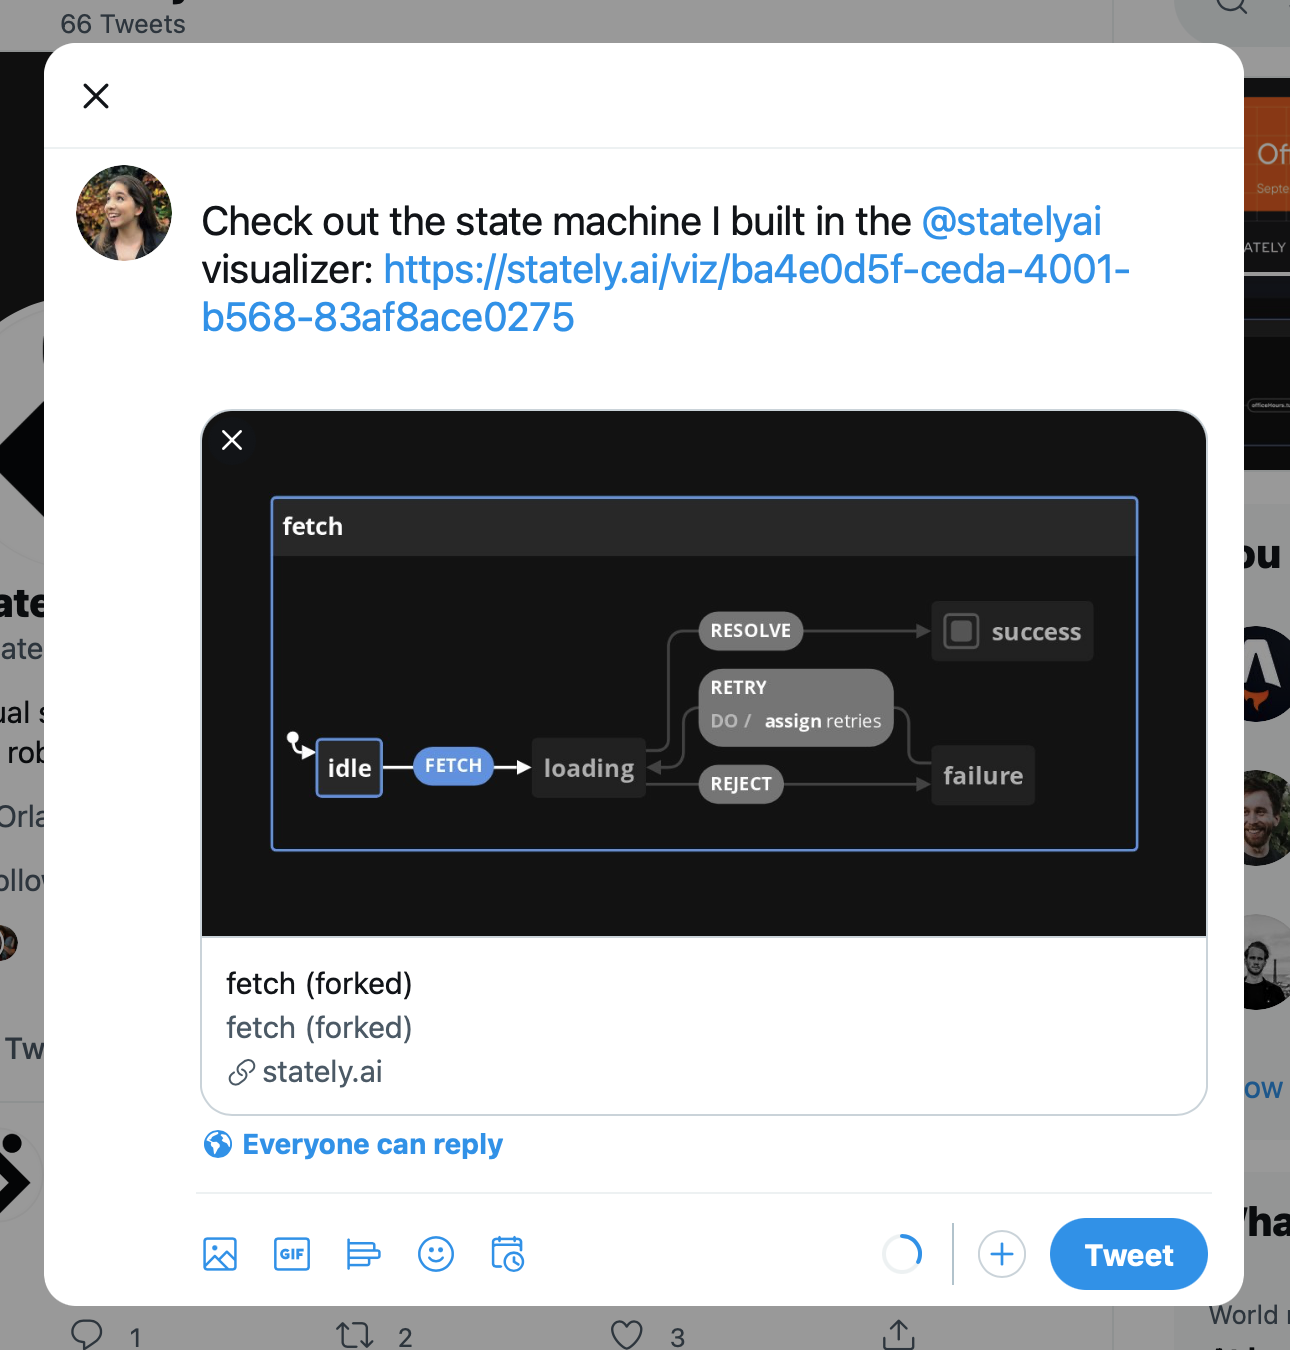
# Twitter link
The Twitter link option in the share menu composes a tweet with a link to the machine’s Visualizer URL.
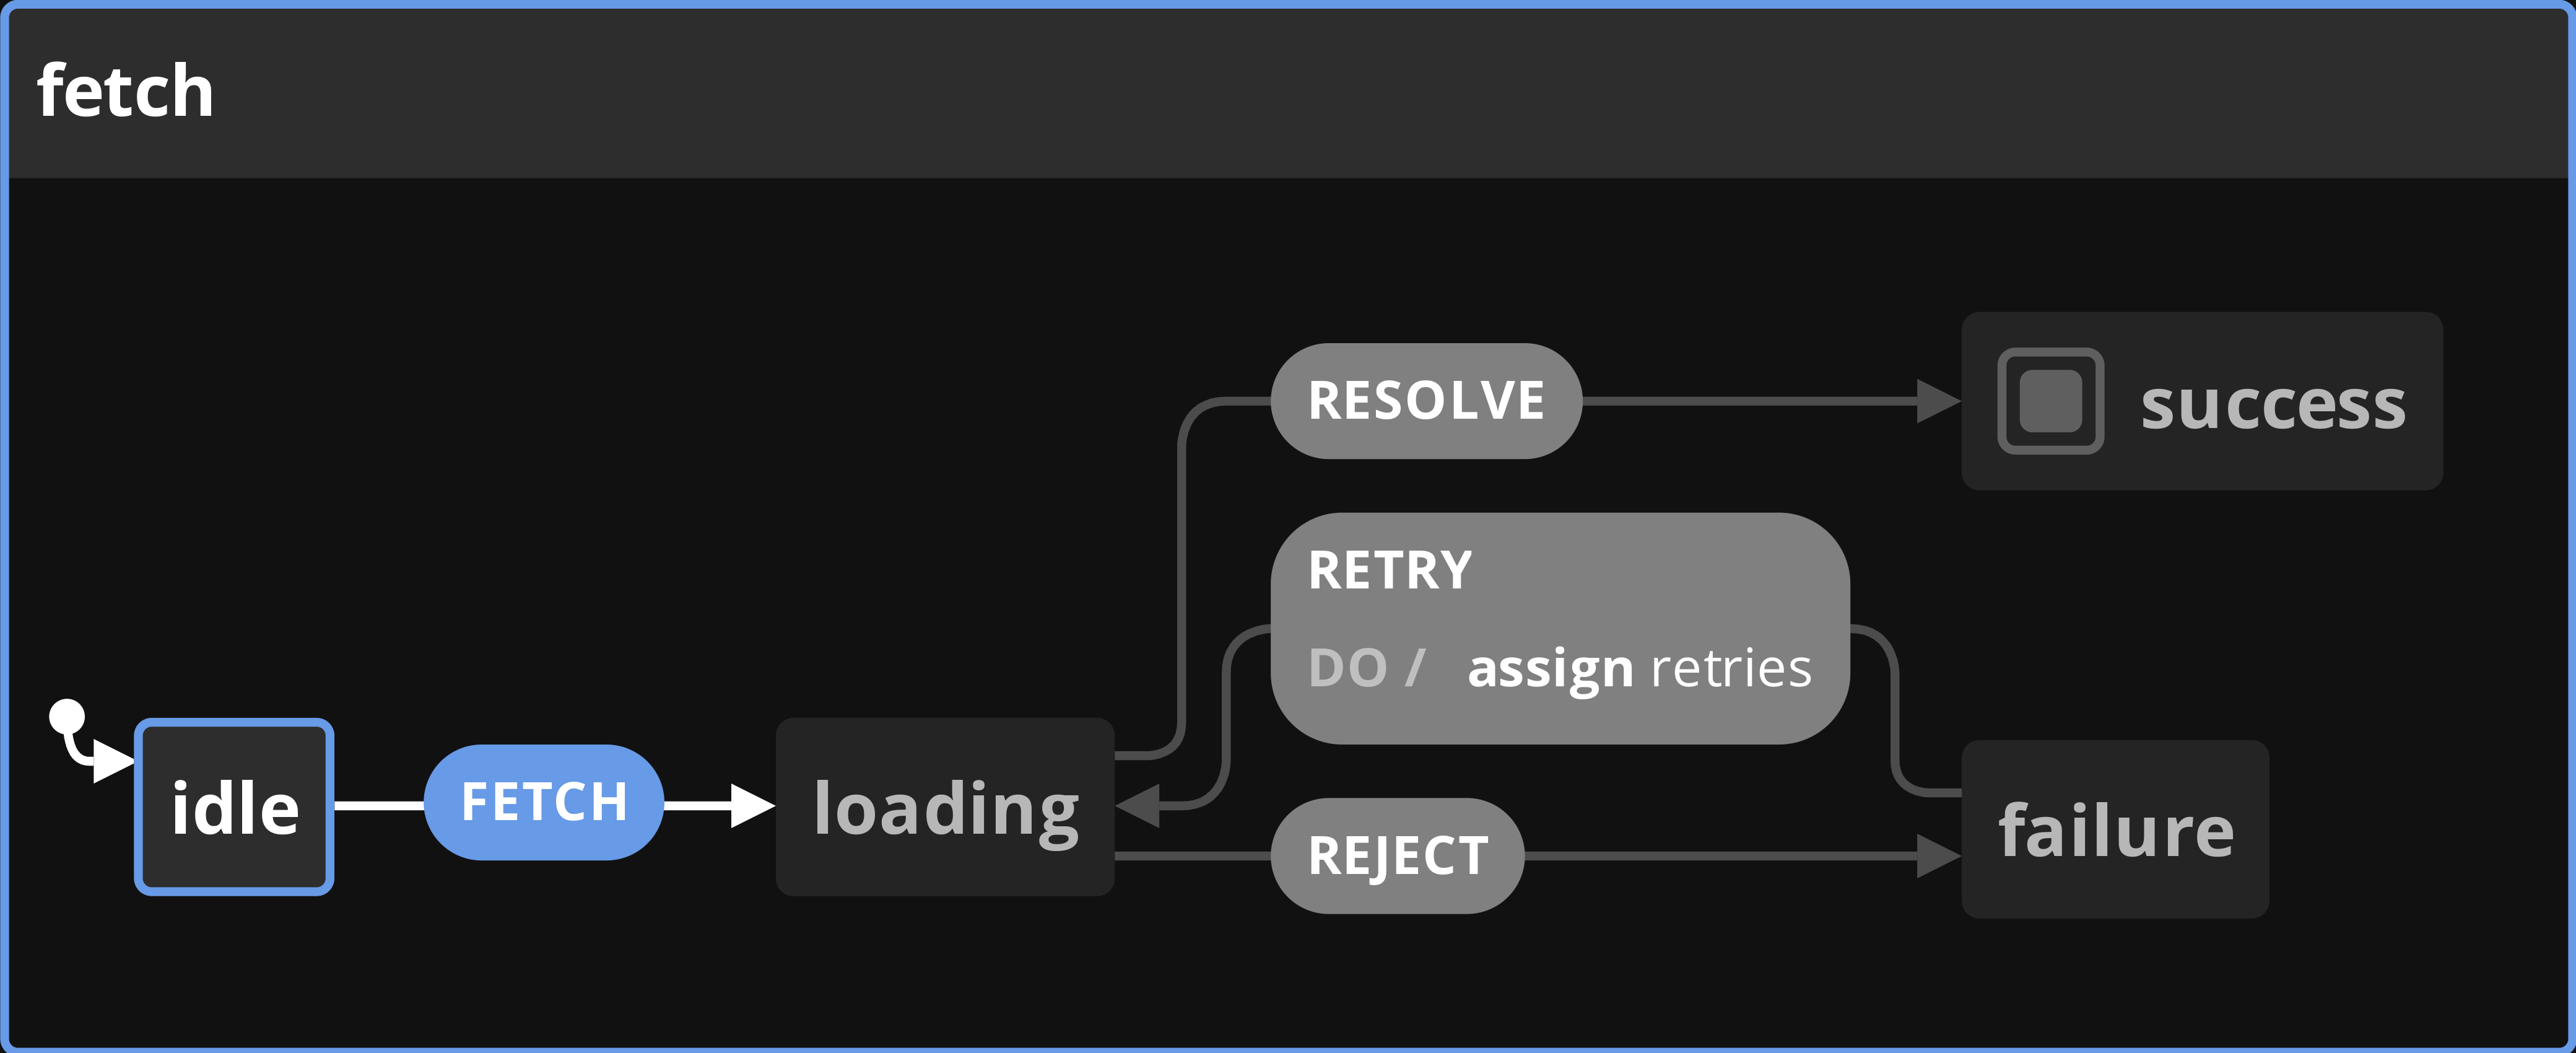
# Live-updating snapshot images
The Copy Image URL option in the share menu copies the URL for the image of the machine to your clipboard. The image is a snapshot of the machine, and will update with any changes to your machine.
The image below is a snapshot of David’s example fetch machine (opens new window).
# Embed mode
The Embed option in the share menu opens an options panel for an embeddable iframe of the machine.
Copy the code from the text area and paste it wherever you want to embed the machine. The machine can be embedded anywhere you can use iframes.
The embedded machine below is David’s example fetch machine (opens new window) in full mode with an active state panel, no link to the Visualizer, and control buttons enabled with panning and zooming both enabled:
You can choose from a number of options for your embedded machine:
# Mode option
The default mode is viz.
- viz: Show only the Visualizer in the embedded iframe.
- panels: Show only the Code, State, Events and Actors panels in the embedded iframe.
- full: Show both the Visualizer and the Code, State, Events and Actors panels in the embedded iframe.
# Show control buttons option
In viz and full modes, there are further options to show the control buttons for the Visualizer. When show control buttons is selected, there are additional options to Allow panning and Allow zooming. If these options are not selected, the buttons will be visible but disabled.
# Panel options
In panels and full modes, there are further options to select the active panel, make the Editor readonly, and show the original link to the Visualizer.
# Fork existing machines
Found a useful machine in the Registry (opens new window)?
You can fork the machine, using the Fork button, and make it work for your own uses.
# Useful error messages
The Visualizer has descriptive error messages to help you understand and correct the issue when your code can’t be visualized.

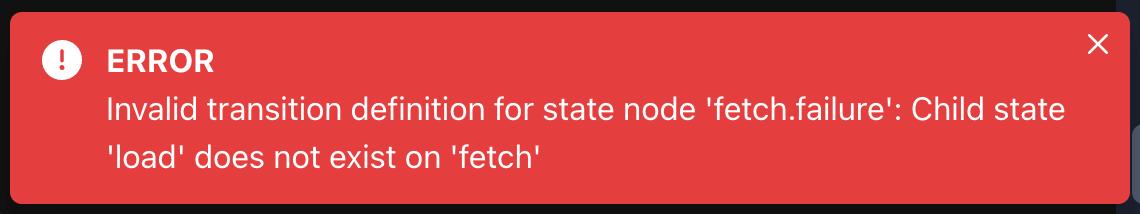

The error will fade away after 4 seconds. Press Visualize to view the error again.
# Custom code editor themes
In the Visualizer’s settings you can choose from thirteen color themes for the code editor, including the default XState Viz theme.
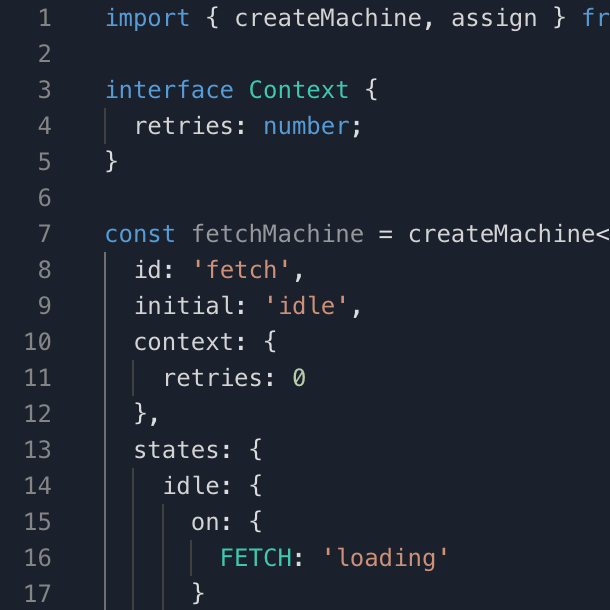 XState Viz
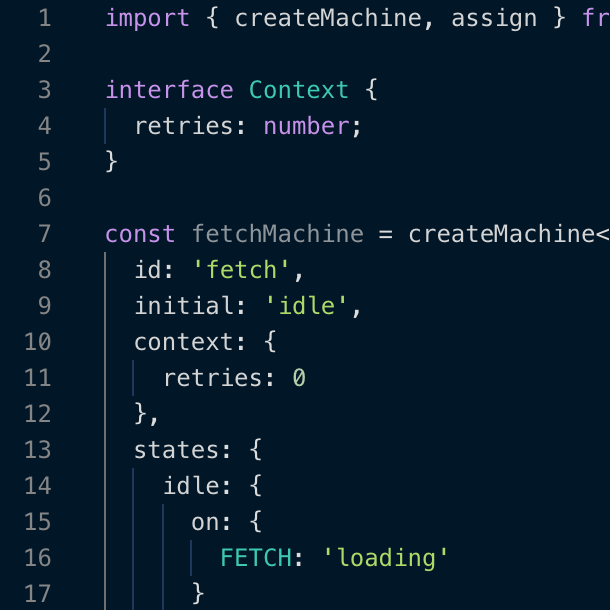 Night Owl
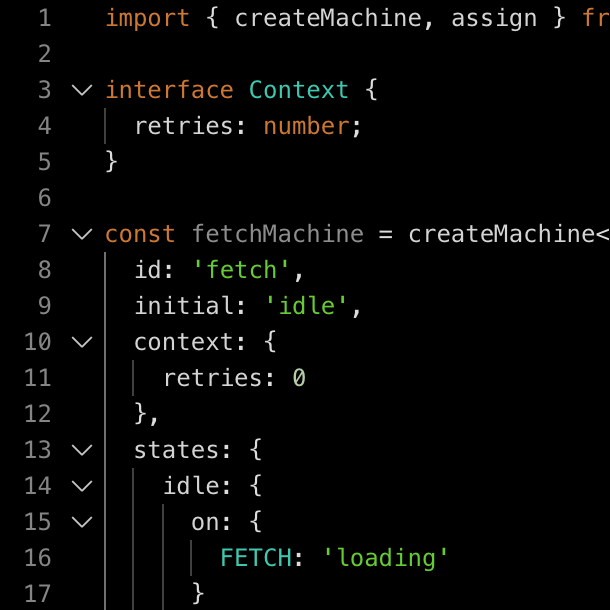 All Hallows Eve
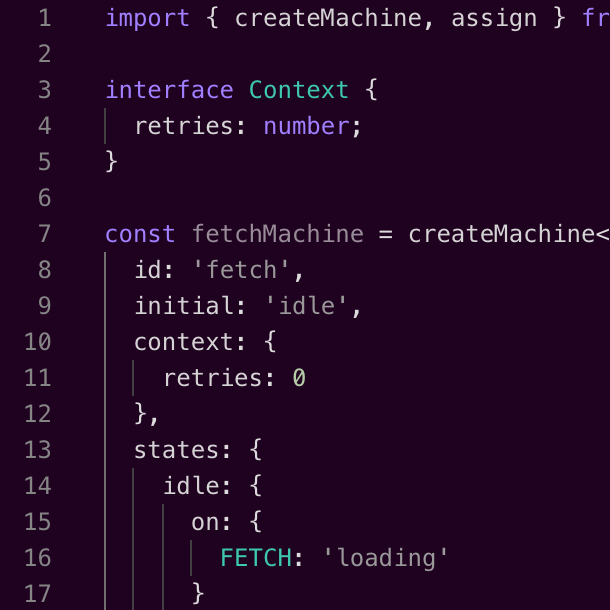 Amy
Amy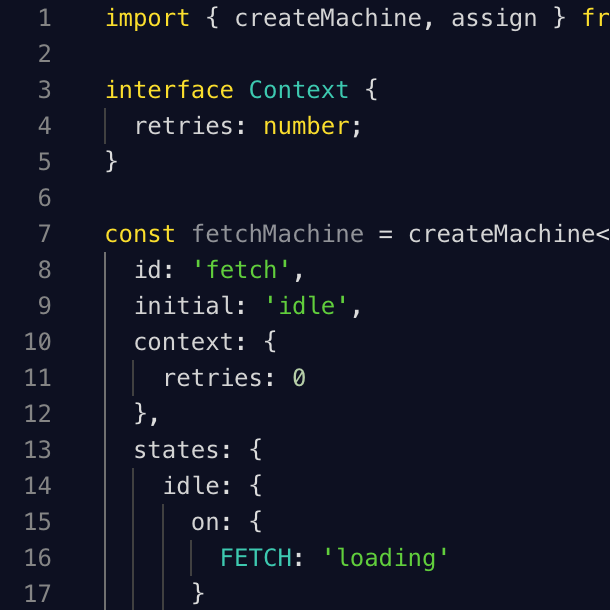 Blackboard
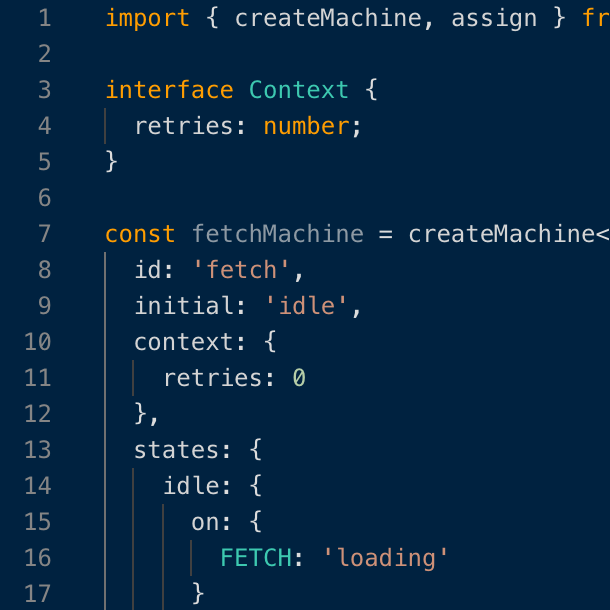 Cobalt
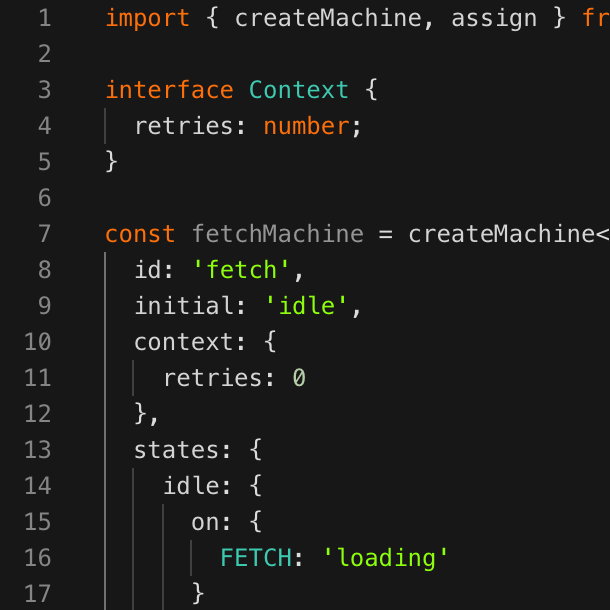 Merbivore Soft
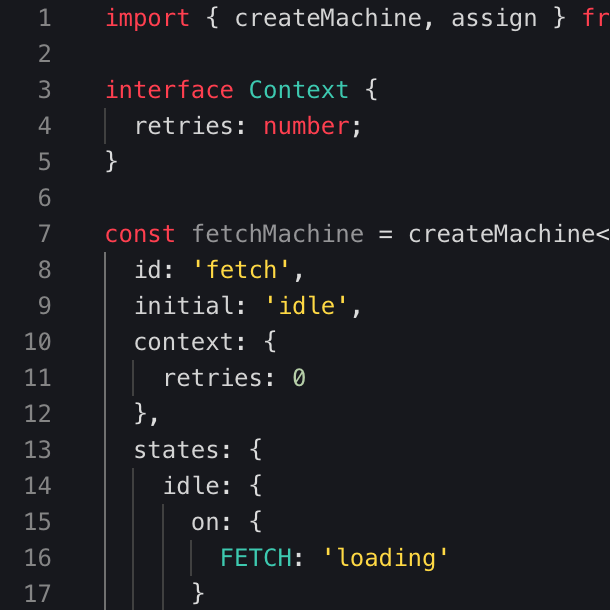 Monokai
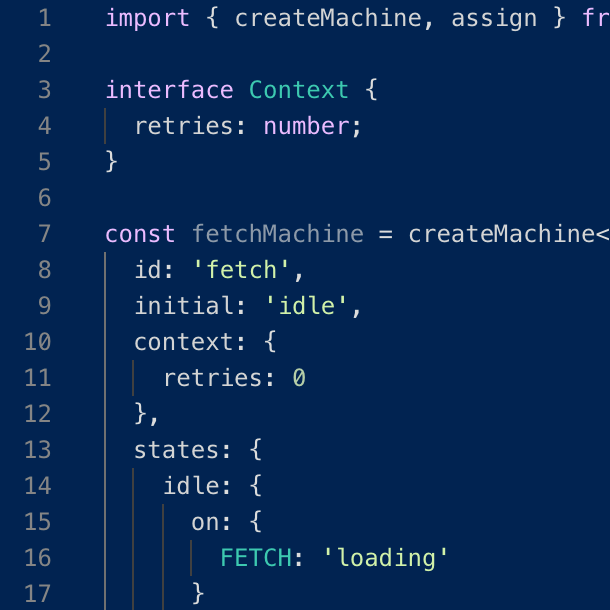 Tomorrow Night
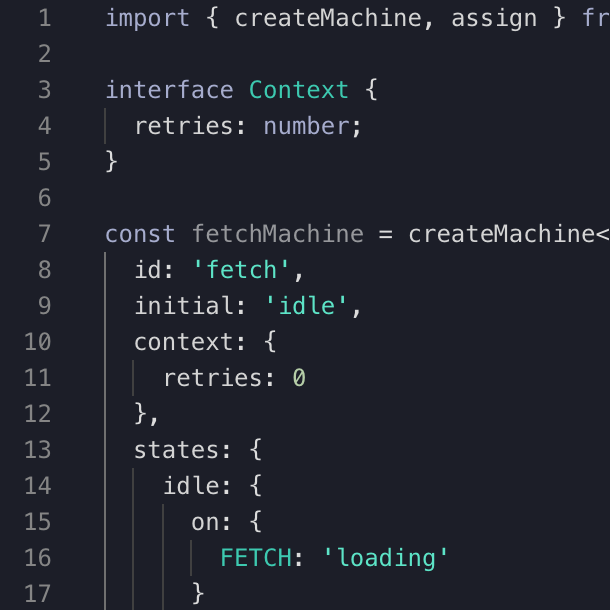 Poimandres
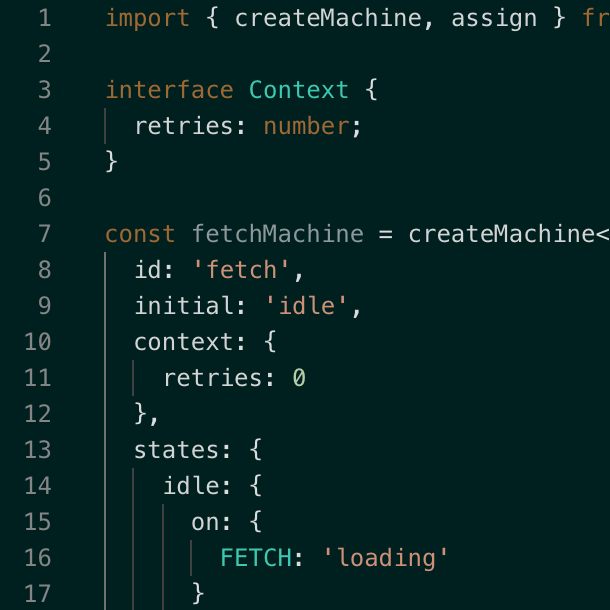 Garden of Atlantis
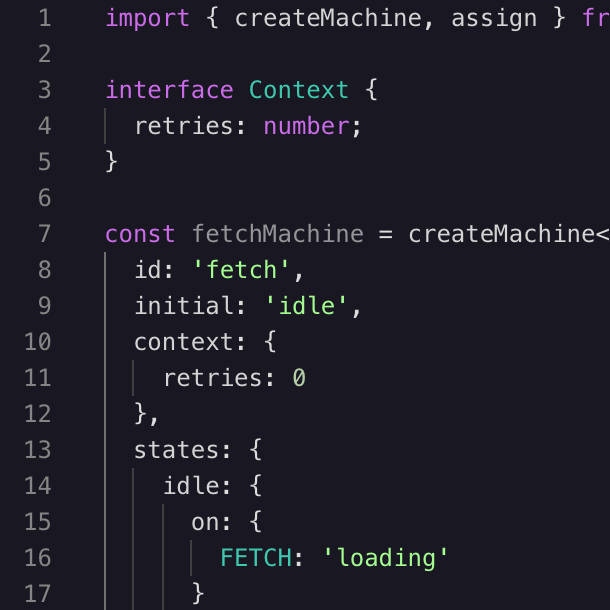 Martian Night
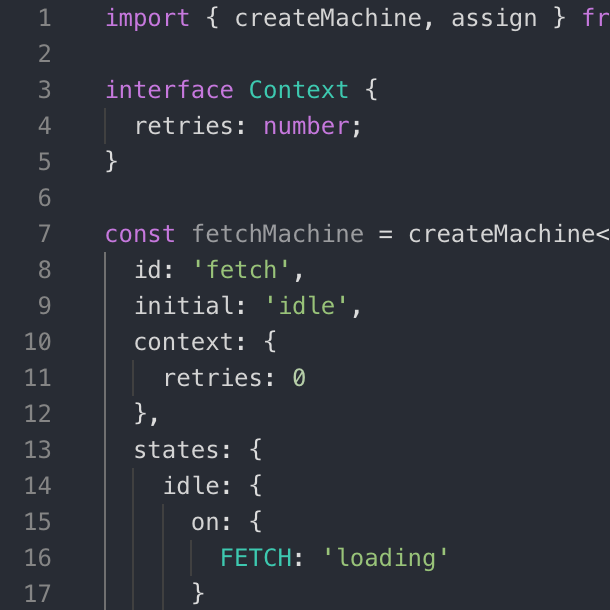 Atom One Dark
# How to change the code editor’s color theme
- Go to Settings using the button in the top menubar.
- Scroll down to the Editor Theme section.
- Choose your preferred theme from the dropdown menu.
- Go back to the Code view using the Code button in the top menubar.
# View controls

The view controls panel helps you navigate around your statechart.
 Zoom out. Zoom out of the canvas to view more of your statechart.
 Zoom in. Zoom into the canvas to view details in your statechart.
 Fit to view. Fit your entire statechart into the available viewing space.
 Reset canvas. Reset the statechart’s position to the top left of the viewing space at 100% zoom level.
 Hand tool. Select the hand tool to enter press and drag mode. Then press, hold and drag to move around the canvas. To exit press and drag mode, deselect the hand tool.
 Reset button. Reset the statechart’s sequence to its initial state.
# Keyboard shortcuts and command palette
You can use keyboard shortcuts for common Visualizer commands. Find the list of Keyboard shortcuts in the Settings.
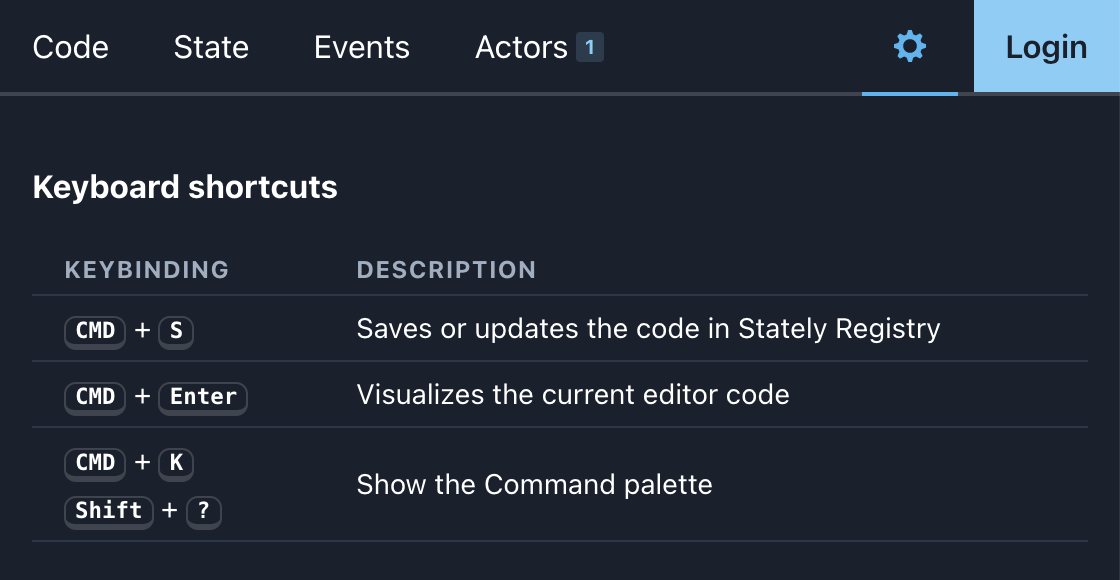
- CMD + S Saves or updates the code in Stately Registry (opens new window).
- CMD + Enter Visualizes the current editor code.
- CMD + K Show the Command palette.
- Shift + ? Show the Command palette.
# Command palette
Use the CMD + K or Shift + ? keyboard shortcut to show the command palette. The command palette gives you quick access to common Visualizer commands.
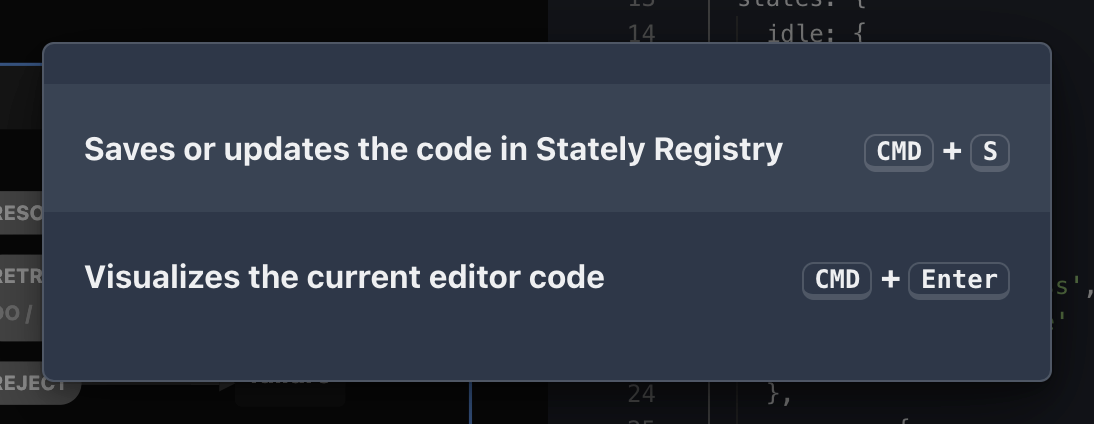
The command palette will have more commands in the future.
# And more…
- Sign in with GitHub
- Auto-saves locally so you won’t lose your work
# Upcoming features
We’ve got many more features coming soon. Including:
- Support for Lucy DSL (domain-specific language)
- Custom event and event payload support
# Get involved
Take me to the Visualizer! (opens new window)
Try the Visualizer in Inspect mode (opens new window)
The Visualizer is available now and will be free and open source forever. Contributions are welcome!
# Feedback and bug reports
If you have any feedback or have any feature requests, please join our Discord server (opens new window) where you’ll find our team and the wonderful XState community.
Please submit any bug reports as GitHub issues on the XState repository (opens new window).
Concepts →